


In this article
Every regulated AI deployment needs explanations. Most get explanations that check compliance boxes without revealing anything useful about model behavior.
LIME explanations change with minor parameter adjustments. SHAP computation takes hours for production-scale models. Attention weights don't indicate causal importance. Gradient-based methods amplify noise in deep networks.
Every popular XAI method has well-documented failure modes. Yet teams deploy them as if they provide ground truth about model behavior, then wonder why production performance doesn't match what explanations predicted.
The gap isn't technical; the methods work as designed. The gap is expectational: what practitioners need from explainability versus what current methods actually deliver.
This guide examines which XAI methods actually help practitioners understand and improve model behavior, which ones are compliance theater that satisfy requirements without providing insight, and how to evaluate whether your interpretability infrastructure is genuine or just sophisticated performance art.
What "works in practice" means for explainable AI methods
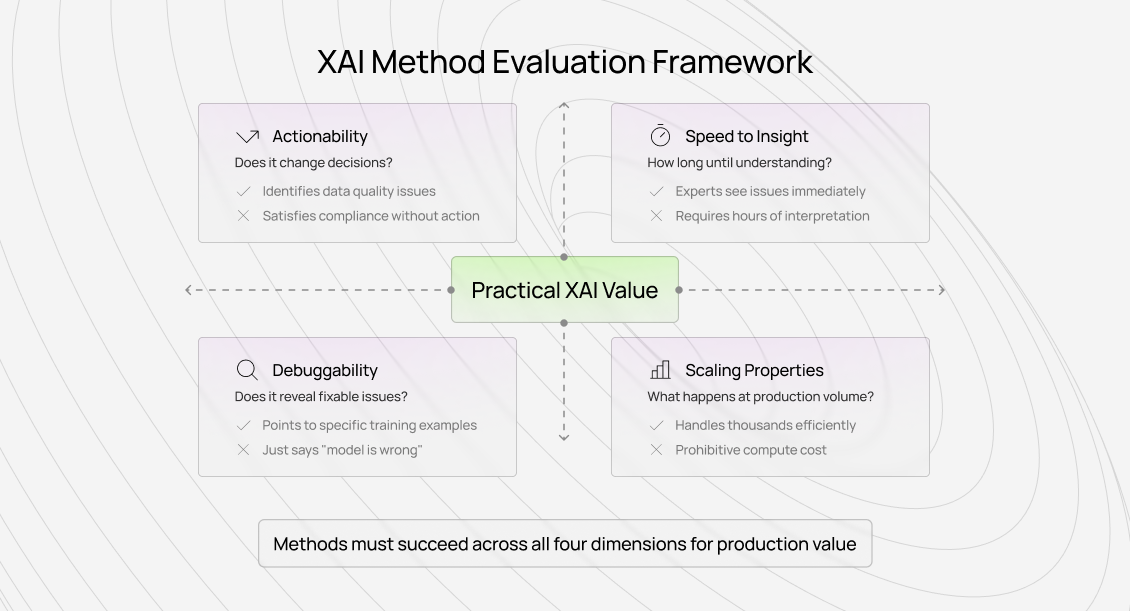
Before evaluating specific methods, we need clear criteria for practical success. Most XAI literature optimizes for explanation fidelity — how accurately explanations represent model behavior. But fidelity doesn't guarantee utility.
An explanation can perfectly capture what a model did while providing zero insight into why it worked, how to improve it, or whether the reasoning is sound. This distinction matters enormously in operational contexts.
Actionability: Does it change decisions?
The first test of practical value: do explanations lead to different actions than you'd take without them?
Real actionability looks like this:
- Identifying and fixing a data quality issue based on attention patterns
- Choosing between model architectures based on the interpretability of learned features
- Debugging a production failure by tracing which inputs drove the wrong prediction
- Catching bias or fairness issues through systematic feature importance analysis
Not actionability:
- Generating explanations that stakeholders review but don't act on
- Creating visualizations that "build trust" without enabling better decisions
- Satisfying regulatory requirements that nobody actually enforces
- Documenting model behavior in ways that don't inform improvements
I track this metric explicitly.
When we implement an interpretability tool, we measure how often explanation analysis leads to actionable changes, such as guideline updates, data cleaning, model architecture decisions, and quality threshold adjustments. If that number stays near zero, the tool is theater regardless of how technically sophisticated it is.
Speed to insight: how long until understanding?
Practical methods provide insight quickly. If stakeholders spend hours interpreting explanations without reaching clear conclusions, the explanation method fails operationally even if it succeeds academically.
The best XAI implementations I've seen have this property: domain experts can look at explanations and immediately identify whether model behavior makes sense.
Doctors can quickly assess whether diagnostic model reasoning aligns with medical knowledge. Annotators can rapidly determine whether quality-scoring models learned genuine quality indicators or annotation artifacts.
Slow insight is expensive insight. If explanation analysis requires extensive ML expertise to interpret, it won't scale across the organization. The method might technically work, but it fails in practice.
Debuggability: Does it reveal fixable issues?
The highest-value XAI methods expose specific, fixable problems. Not just "the model is wrong", we already know that from error analysis. But "the model is wrong because it learned spurious correlation X" or "performance dropped because annotation pattern Y changed."
Methods that excel at debuggability:
- Point to specific training examples that caused problematic behavior
- Reveal when model performance stems from shortcuts rather than genuine understanding
- Identify the distribution shift by showing how feature importance changed over time
- Expose data quality issues by highlighting what models actually learned from annotations
Methods that fail at debuggability generate explanations that describe model behavior but do not suggest how to improve it. They answer "what" without illuminating "why" in ways that enable fixes.
Scaling properties: what happens at production volume?
Academic XAI demonstrations typically explain dozens to hundreds of predictions. Production systems need to explain thousands or millions.
Some methods that work well on small examples become computationally prohibitive at scale. Others produce individually reasonable explanations but create contradictions or inconsistencies when viewed systematically across many instances.
We explicitly evaluate scaling: can you generate explanations for an entire production batch without excessive compute cost? Can stakeholders efficiently review explanation patterns across thousands of instances? Does explanation quality degrade as volume increases?
The operational reality of explainable AI methods
Let's examine major XAI approaches through the lens of what works in production environments.
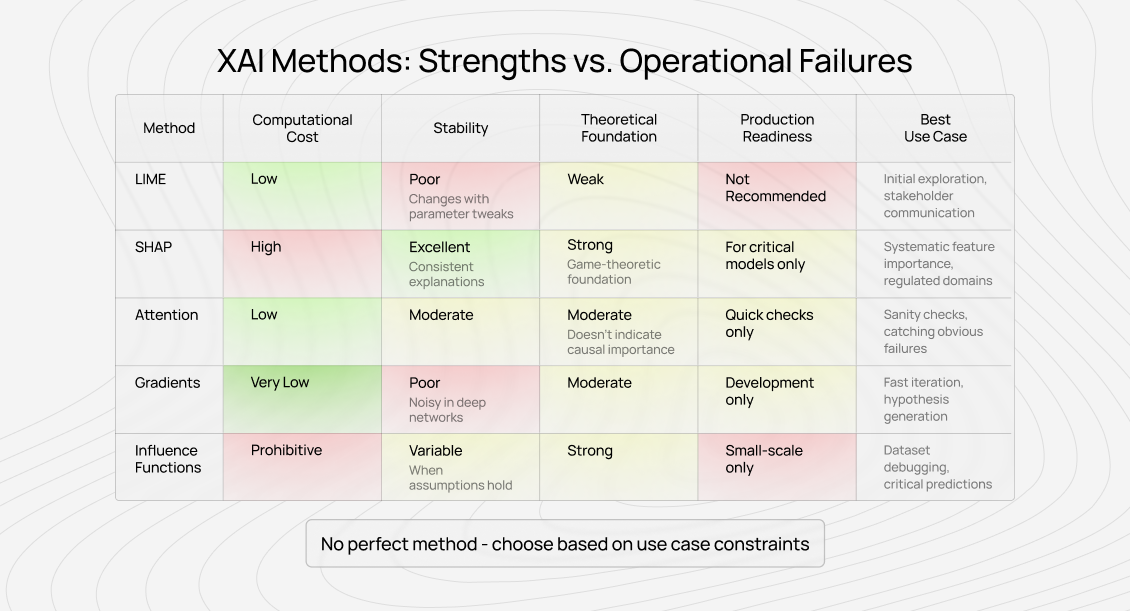
LIME: beautiful theory, unstable practice
Local Interpretable Model-Agnostic Explanations (LIME) is probably the most widely implemented XAI method. It's conceptually elegant, model-agnostic, and produces visualizations that stakeholders find intuitive.
Where LIME succeeds: Quick prototyping and initial model exploration. When you need rough intuition about what features might matter, LIME provides that faster than most alternatives. For presentations and stakeholder communication, LIME visualizations are accessible to users without a technical background.
Where LIME fails operationally: Stability. Run LIME twice on the same prediction with slightly different parameters, and you'll get various explanations. Sometimes dramatically different. This isn't a bug; it's fundamental to how LIME works, but it destroys operational trust.
I've watched teams waste weeks investigating why LIME indicated that different features were essential for similar predictions, only to realize the explanations were unstable and didn't reveal genuine model differences. The instability makes LIME nearly useless for systematic debugging or quality monitoring.
The deeper issue: LIME doesn't actually show what the model did. It shows what a linear model would do if trained to approximate the complex model locally. That's one layer of approximation removed from the truth, and in practice, it often produces explanations that look plausible but misrepresent the model's actual behavior.
My practical recommendation: Use LIME for initial exploration and communication, never for systematic debugging or production monitoring. If LIME reveals something interesting, validate it through other methods before acting on it.
SHAP: theoretically sound, computationally expensive
SHapley Additive exPlanations (SHAP) addresses LIME's stability issues by grounding them in solid game-theoretic foundations. It produces consistent explanations with desirable mathematical properties.
Where SHAP succeeds: Systematic feature importance analysis across many predictions. SHAP values can be aggregated meaningfully, unlike LIME explanations. For tabular data with interpretable features, SHAP often provides the most reliable feature attribution available.
We use SHAP extensively to understand the quality of annotation models. When SHAP consistently shows specific annotation patterns correlate with quality scores, those patterns become part of our quality rubrics — because SHAP's consistency means we can trust the attribution.
Where SHAP fails operationally: Computation cost for large models or high-dimensional inputs. Exact SHAP computation requires evaluating the model on exponentially many feature combinations. Approximations help, but they reintroduce the stability issues SHAP was supposed to solve.
More subtly, SHAP assumes feature independence. Real features rarely satisfy this assumption. The importance of correlated features is distributed in ways that can be misleading, especially for highly correlated annotation patterns.
My practical recommendation: SHAP is worth the computational cost for critical models in regulated domains or systematic quality analysis. For rapid debugging or less critical applications, the cost-benefit often doesn't justify it. Use TreeSHAP for tree-based models where it's computationally feasible.
Attention visualization: intuitive but overinterpreted
Transformer models made attention visualization popular. The mechanism seems perfectly designed for interpretability: we can literally see what the model "looks at" when making predictions.
Where attention succeeds: Understanding what language models capture about syntax and semantics. Debugging edge cases by examining where attention fails. Catching obvious problems like models attending to position markers or formatting artifacts rather than content.
I've used attention visualization to detect issues with annotation guidelines dozens of times. When models attend to structural markers that annotators inadvertently encoded, it's immediately visible in attention patterns. This catches problems that accuracy metrics miss.
Where attention fails operationally: Attention weights don't necessarily indicate causal importance. Models can achieve similar performance with randomized attention. High attention might just mean information routing, not that the token was essential for the prediction.
The bigger issue: attention visualization tempts overinterpretation. Stakeholders see heat maps highlighting specific words and assume those words drove the decision. But attention is one mechanism in a complex system. It doesn't capture the full reasoning process.
My practical recommendation: Attention visualization is valuable for quick sanity checks and catching obvious failures. Don't treat it as ground truth for "what the model used." Validate attention-based insights through ablation studies before acting on them.
Gradient-based methods: fast but noisy
Saliency maps, Integrated Gradients, and related techniques compute gradients to identify important input features. They're computationally cheap and work for any differentiable model.
Where gradients succeed: Quick debugging of image models. When you need rapid feedback about which image regions influenced predictions, gradient methods provide it orders of magnitude faster than alternatives.
For text, gradient-based importance scores help identify which words contributed to classification decisions without the computational cost of SHAP or the instability of LIME.
Where gradients fail operationally: Noise and saturation issues. Deep networks can have vanishing or exploding gradients that make saliency maps unreliable. Adversarial examples demonstrate that high-gradient regions don't always correspond to human-interpretable features.
Integrated Gradients addresses some issues by integrating along a path from the baseline to the input, but the choice of baseline introduces assumptions that affect the results.
My practical recommendation: Gradient methods are excellent for fast iteration during model development. Don't rely on them for high-stakes decisions or regulatory compliance. Use them to generate hypotheses, then validate through more robust methods.
Influence functions: powerful when they work
Influence functions trace predictions back to specific training examples, answering "which training data points most affected this prediction?"
Where influence functions succeed: When they work, they provide unmatched insight. Finding that mislabeled training data influenced a wrong prediction enables immediate fixes. Identifying influential examples helps debug model behavior and improve dataset quality.
Where influence functions fail operationally: Computational cost and numerical stability. Computing influence requires Hessian calculations that become prohibitive for large models. Approximations help but introduce accuracy issues.
More fundamentally, influence functions assume certain mathematical properties that real neural networks don't always satisfy. When assumptions break down, influence estimates can be wildly wrong.
My practical recommendation: Use influence functions for small-scale models or critical predictions where the computational cost is justified. For large-scale production systems, the cost-benefit typically doesn't work. Consider approximate influence methods for dataset debugging during development.
How to evaluate explainable AI (XAI) methods for your use case
Which explainable AI method should you use? The unstable one? The prohibitively expensive one? The one that's systematically misleading? Or the one that amplifies noise?
Not every technique works for every application.
Here's how to evaluate which XAI approaches suit your specific needs.
Start with operational requirements, not technique availability
Most teams approach XAI backwards: they implement LIME or SHAP because those are popular methods, then figure out how to use the explanations. This produces explanations that satisfy no one.
Instead, start with questions you actually need answered:
- Do you need to debug systematic model failures?
- Do you need to satisfy regulatory requirements?
- Do you need to communicate model behavior to non-technical stakeholders?
- Do you need to detect data quality issues?
- Do you need to validate that models learned correct patterns versus shortcuts?
Different questions require different methods. Regulatory compliance might require SHAP's theoretical guarantees even if it's computationally expensive. Rapid debugging might prioritize gradient methods despite their noisiness.
Stakeholder communication may still need LIME's intuitive visualizations despite concerns about instability.
Validate explanation quality systematically
Don't assume explanations are correct just because they look plausible.
You need to validate systematically:
Ablation testing: If an explanation claims Feature X drove the prediction, remove Feature X and verify the prediction changes as expected. Explanations that fail ablation tests are unreliable regardless of how authoritative they look.
We do this constantly for quality models. SHAP might indicate that an annotation pattern matters, but if we artificially remove that pattern and quality scores don't change meaningfully, the explanation misrepresented model behavior.
Cross-method validation: Run multiple explanation methods. They should broadly agree even if details differ. Systematic disagreement signals either complex model behavior requiring investigation or explanation method failure.
Expert evaluation: Domain experts should be able to assess whether explanations align with their understanding. Not perfectly (models sometimes discover novel patterns), but egregious misalignments signal problems.
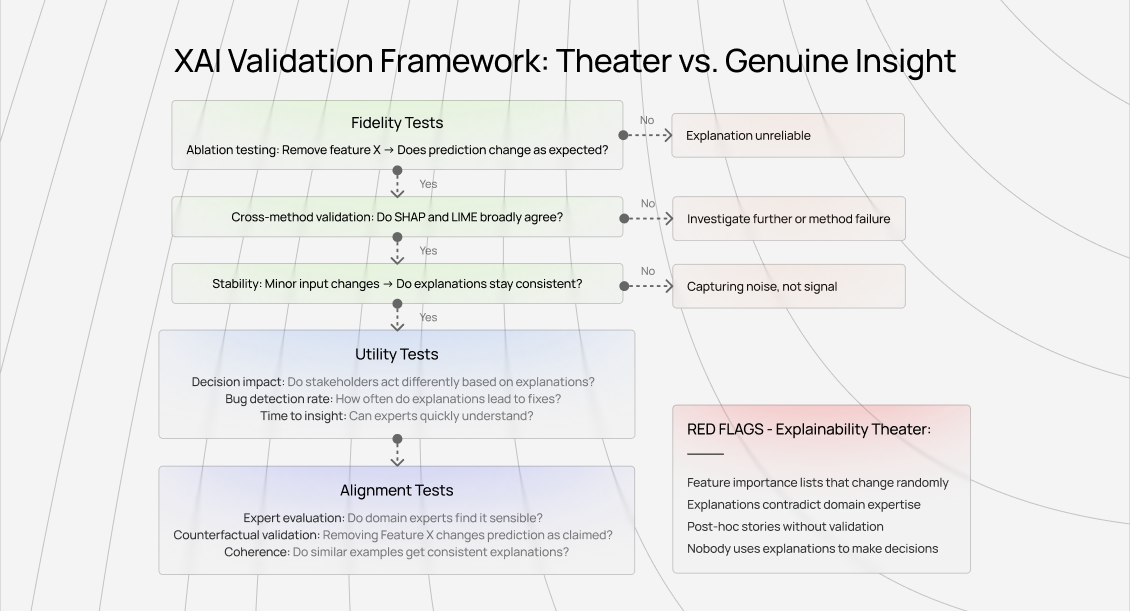
Measure explanation utility, not just fidelity
The explanation that most accurately represents the model's behavior isn't necessarily the most useful.
You need to optimize for utility:
Decision impact: Track whether explanations change decisions. Do they reveal actionable issues? Do they enable better model improvements? If not, the explanation method fails operationally regardless of technical quality.
Time to insight: How long until stakeholders reach an actionable understanding? Explanations that require extensive interpretation provide less value than methods offering immediate insight.
Consistency across similar cases: Explanations for similar predictions should tell consistent stories. High variance in explanations for similar inputs suggests noise rather than signal.
Applying explainable AI methods in AI training work
For annotators and data quality specialists, the explainability landscape creates both opportunities and challenges.
Quality patterns become quantifiable
Interpretable quality systems make annotation patterns explicit. This creates accountability but also opportunity. When quality models can explain what separates high-quality work from low-quality work, that knowledge transfers to training and improvement.
The best annotators I've worked with actively engage with feedback on explainability. They ask to see attention patterns on their annotations, investigate when quality models flag unexpected issues, and refine their approach based on what quality systems reveal.
This differs from traditional quality review, where a senior annotator provides subjective feedback. Explainable quality systems provide objective, systematic feedback tied to specific, measurable patterns.
Domain expertise becomes more valuable
Interpretable systems reveal which aspects of domain expertise actually matter for model performance. Not all expertise transfers to better annotations. Some domain knowledge is irrelevant to the ML task.
Explainability shows which types of expert knowledge improve annotations: edge case handling, contextual judgment, systematic consistency, or something else entirely. This helps experts focus their efforts on high-value contributions.
Quality standards become more specific and actionable
Vague quality criteria like "thoroughness" or "accuracy" become concrete when explainability reveals what quality models actually learned.
If quality explanations consistently show that handling ambiguous cases with specific documentation patterns correlates with high scores, that pattern becomes part of quality standards.
If attention visualization reveals high-quality annotators consistently attend to certain types of detail, those details become training focus areas.
This transforms quality from subjective assessment to measurable skill development.
Contribute to AGI development at DataAnnotation
The explainable AI methods shaping frontier models require human intelligence that no synthetic dataset can replicate.
When quality systems reveal what separates excellent work from mediocre work, when attention patterns expose which details actually matter, that feedback loop depends on annotators who understand what they're evaluating.
If your background includes technical expertise, domain knowledge, or the critical thinking to evaluate complex trade-offs, AI training at DataAnnotation positions you at the frontier of AGI development.
Over 100,000 remote workers have contributed to this infrastructure.
If you want in, getting from interested to earning takes five straightforward steps:
- Visit the DataAnnotation application page and click "Apply"
- Fill out the brief form with your background and availability
- Complete the Starter Assessment, which tests your critical thinking skills
- Check your inbox for the approval decision (typically within a few days)
- Log in to your dashboard, choose your first project, and start earning
No signup fees. We stay selective to maintain quality standards. You can only take the Starter Assessment once, so read the instructions carefully and review before submitting.
Apply to DataAnnotation if you understand why quality beats volume in advancing frontier AI — and you have the expertise to contribute.

Phoebe is a California native currently based in Vermont. When she's not working, she enjoys traveling, playing drums, writing songs, and exploring the outdoors. With a background in public health and clinical research, Phoebe built a successful career in project management across both public and private sectors before joining DataAnnotation. She's excited to contribute to the platform's growth and its role in shaping the future of AI.
Related posts


Get ahead in a changing workforce.
No recruiters. No interviews. Just meaningful work and real compensation.