The first time your system handles a million concurrent requests, you learn which principles matter and which are just architectural theater.
Autoscaling that looked perfect in staging crumbles under real traffic patterns. Load balancers that passed benchmarks create bottlenecks you never anticipated. Caching strategies that worked for thousands of users introduce consistency problems at scale.
Netflix's autoscaling architecture, Amazon's elastic infrastructure, and Google's distributed systems all share one core principle: they design scalable systems that treat failure as inevitable rather than exceptional.
We operate one of the world's largest AI training marketplaces, coordinating over 100,000 remote workers across billion-dollar frontier model infrastructure. These lessons come from the autoscaling decisions that worked, the architectural choices that didn't, and the patterns that separate systems handling thousands of requests from those handling millions.
This article distills those patterns into six principles, backed by production numbers rather than theoretical concepts.
You'll learn how to decouple services without creating debugging nightmares, scale data layers that perform under pressure, build observability that catches problems before users do, and engineer fault tolerance that survives regional outages.
1. Forecast and measure load before scaling decisions
Your backend can jump from a few thousand requests a minute to a sudden swarm, and every core on the primary node maxes out. Right there, you learn the practical difference between vertical and horizontal scaling fast:
- Vertical scaling means adding more CPU or memory to a single machine — it buys time, but capacity still hits a ceiling when racks fill up.
- Horizontal scaling spreads traffic across multiple smaller nodes, the approach that lets systems spin up containers on demand.
For example, Netflix scales horizontally by distributing traffic across thousands of AWS EC2 instances, but the decision about when to scale matters more than the mechanism.
Why reactive scaling fails at scale
Most teams start with reactive autoscaling — watch CPU hit 80%, spin up new instances, wait for them to warm up. This approach fails during rapid demand increases because instance startup can take 10-45 minutes while traffic doubles every 5 minutes.
By the time new capacity comes online, the existing fleet is already overwhelmed, and users are hitting timeouts.
Netflix evolved beyond this with Scryer, their predictive autoscaling engine.
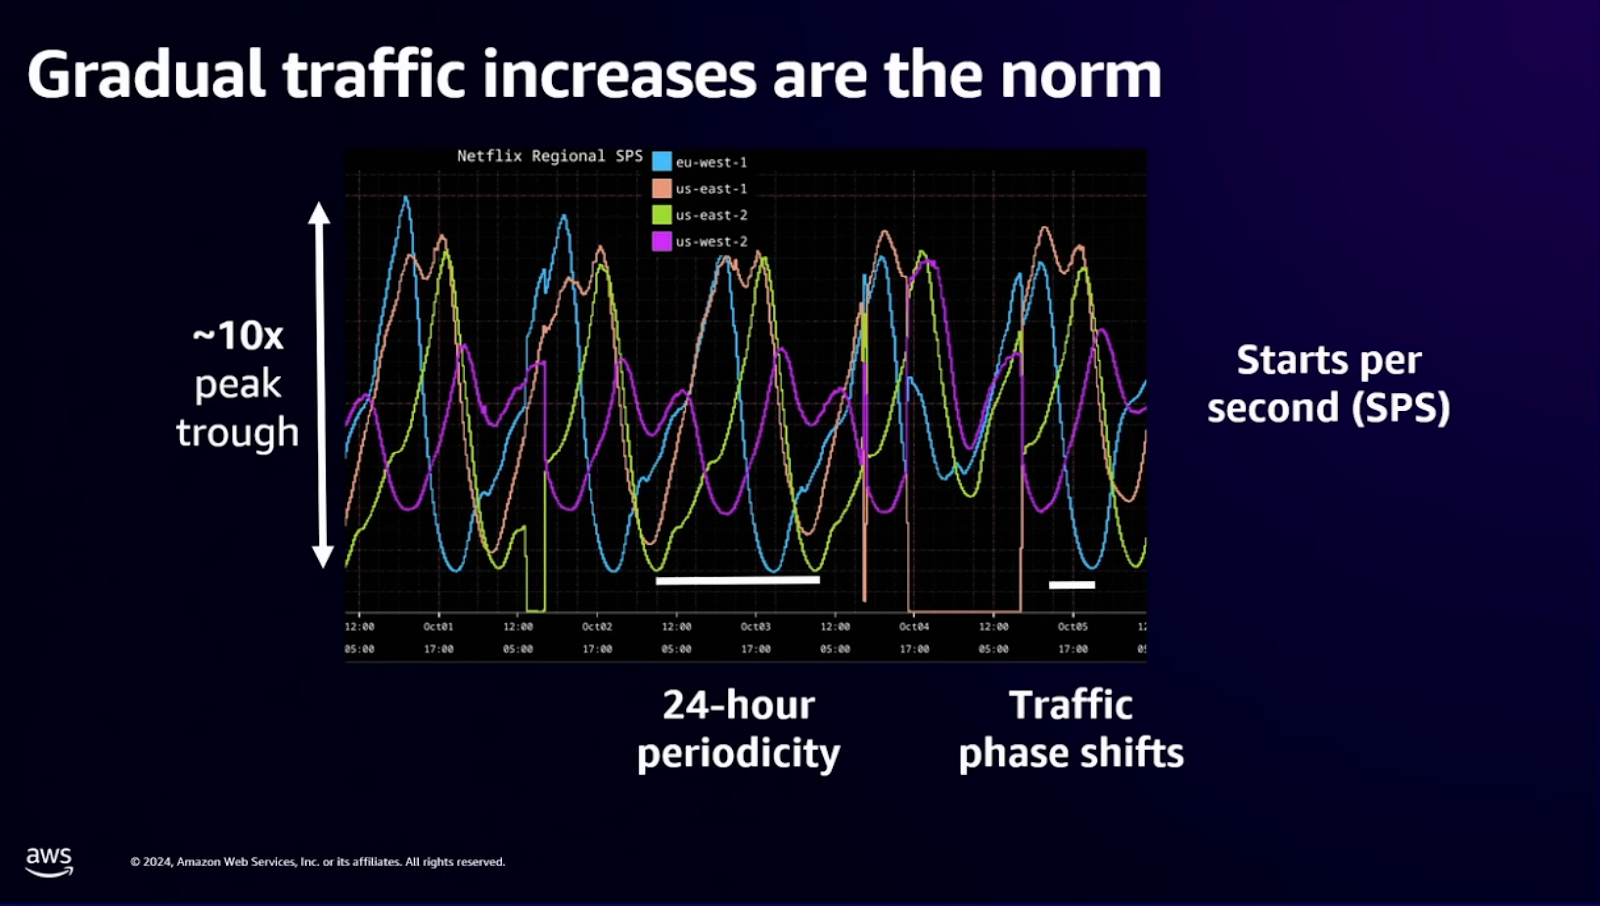
Scryer predicts future capacity needs before demand spikes by analyzing historical patterns, handling scenarios where reactive systems fail: rapid demand increases, outages followed by retry storms, and variable traffic patterns across different times of day.
The principle generalizes beyond Netflix's scale. Systems managing distributed workloads (whether streaming video or coordinating remote workers across infrastructure) benefit from predictive capacity planning.
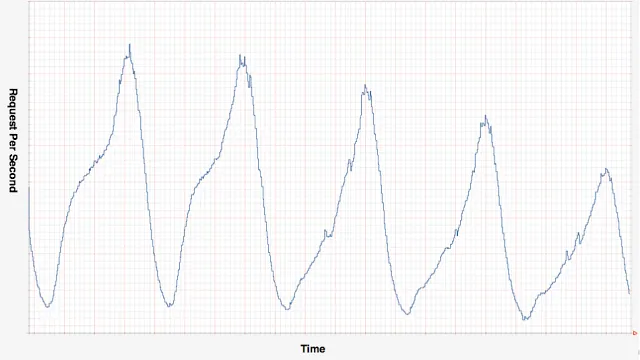
Platforms processing millions of events daily baseline traffic patterns before autoscaling, setting alerts around saturation thresholds where queue depth climbs or CPU hovers near redline before new workers launch automatically.
Capacity signals that matter
Forecasting works when you measure the right signals:
- Baseline your daily and weekly traffic in analytics dashboards before you autoscale
- Monitor CPU saturation above 70% to catch approaching resource limits before performance degrades
- Track p95 latency targets to identify response time slowdowns before they affect most users
- Watch queue depth trends because rising backlogs signal insufficient processing capacity
- Map cost curves per scaling tier to balance performance improvements against infrastructure spending
These signals feed into capacity planning sessions that turn patterns into concrete "step functions" — when queue depth exceeds 1000 items, provision 50% more workers; when p95 latency crosses 250ms, add capacity even if CPU looks fine. The goal is headroom, not perfect utilization.
Capacity modeling works best when you combine baseline metrics with load testing results. Run synthetic traffic that mimics production patterns — not just steady-state load, but realistic spikes, gradual ramps, and sudden drops that trigger scale-down logic.
Feed those numbers back into your autoscaling rules, iterate, and the cycle keeps your infrastructure elastic instead of brittle.
The architectural choice between vertical and horizontal scaling matters less than understanding your actual load patterns and building measurement systems that trigger capacity changes before users notice problems.
2. Decouple services without creating operational chaos
Your tangled monolith can block releases and slow innovation, creating the classic "it works on my machine" bottleneck that emerges as traffic climbs. Teams break free by carving that monolith into services, each one small enough to test, deploy, and roll back independently.
But microservices introduce their own complexity: distributed debugging, network failures, version skew, and operational overhead that can easily exceed those of the monolith.
Netflix's transition demonstrates both the benefits and costs. They moved from a monolithic architecture that faced debugging difficulties and single points of failure to microservices that achieve independent scaling, faster development, and improved fault isolation.
But this transformation required building entire platforms for service discovery, distributed tracing, configuration management, and deployment orchestration.
Domain-driven boundaries vs. technical layers
The difference between successful and failed microservices transformations often comes down to where you draw service boundaries. Splitting by technical layers (putting all controllers in one service, all data access in another) creates services that can't function independently.
Every feature requires coordinated changes across multiple services, defeating the purpose of decoupling.
Domain-driven design works better.
Split services along business capabilities:
- User management handles everything about accounts and authentication
- Project orchestration manages workflow state and assignments
- Billing owns payment processing and invoicing
Each service encapsulates a complete business function, with its own data store, deployment cadence, and scaling profile.
A practical example: platforms coordinating distributed work split user authentication, project allocation, quality measurement, and payment processing into separate services.
When project allocation needs to scale to handle millions of assignments while payment processing runs steadily at lower volume, independent services let you optimize each workload differently.
When you need to update quality measurement algorithms without affecting payment logic or service boundaries, service boundaries prevent deployment coupling.
Circuit breakers prevent cascading failures
When one service goes down, naive retry logic can amplify the problem. Every caller retries failed requests, overwhelming the struggling service and preventing recovery. Circuit breakers solve this by detecting failures and temporarily halting requests to unhealthy dependencies.
Netflix addressed dependency, scale, and variance challenges with proven solutions: circuit breakers to contain failures, autoscaling to handle variable load, and automation to reduce operational toil.
These patterns guide organizations transitioning to or optimizing microservices architecture, but they require investment in operational tooling that monoliths never needed.
Here are the key architectural decisions that separate successful microservices from failed attempts:
- Domain-driven boundaries: Split services along business capabilities, not technical layers
- Stateless design: Enable accurate horizontal scaling by removing session dependencies
- API gateway routing: Centralize authentication, rate limiting, and request routing
- Event-driven backbone: Distribute traffic across regions through asynchronous messaging
- Circuit breakers and bulkheads: Contain failures and prevent cascading outages
Engineering leaders discuss these architectural trade-offs in staff-level interviews because the decisions reveal systems thinking beyond just writing code.
3. Scale the data layer before it becomes the bottleneck
A single write-hotspot can push your p95 response time to 2 seconds, and suddenly every other optimization becomes irrelevant. When that happens, the quickest win is to stop forcing every request through the same disk spindle or cloud region.
But data layer scaling introduces challenges that application layer scaling doesn't face: consistency guarantees, transaction boundaries, migration complexity, and the reality that most teams underestimate how hard distributed data actually is.
The standard playbook involves sharding for writes, replication for reads, and caching for everything you can get away with. Each technique solves specific problems while introducing new ones that you need to understand before implementing them in production.
Sharding by user ID or project ID
Start by slicing the workload horizontally. Most teams use customer ID or project ID as their shard key because it naturally partitions data — user A's data never needs to join with user B's data, so that you can store them on completely different database servers.
Instagram's sharded system demonstrates this approach at scale: several thousand logical shards are mapped to fewer physical shards, allowing them to be moved between database servers without re-bucketing all the data.
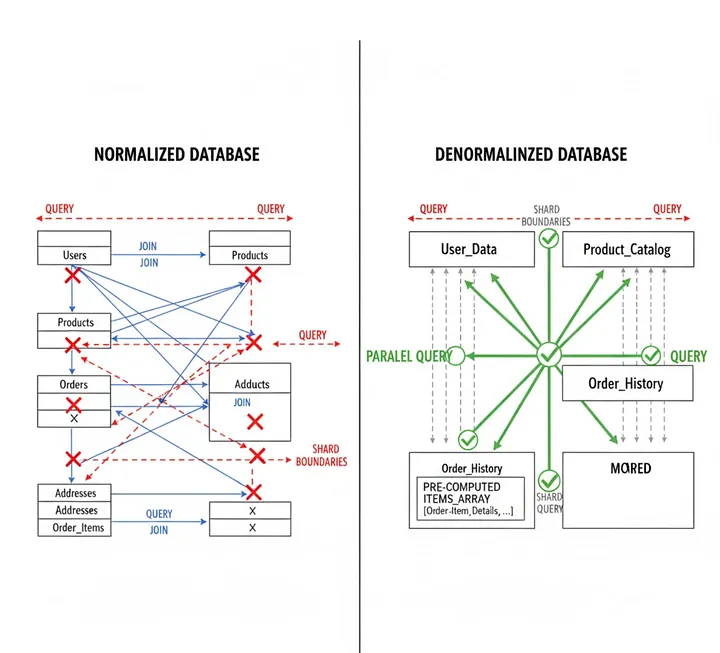
Instagram shards by user ID, with logical shards mapped to Postgres schemas. Each slice runs independently, so you can reindex or back up one slice without pausing the entire service.
They generate unique IDs by combining the current time (41 bits), a shard ID (13 bits), and an auto-increment sequence (10 bits), creating 1,024 IDs per shard per millisecond. This approach avoided the complexity of running separate ID services while maintaining time-sortable unique identifiers.
The challenge with sharding arises when you need to query across shards — aggregating metrics across all users, generating global rankings, or joining data on different servers. Some workloads can't be effectively sharded because they require frequent cross-shard queries. Understanding your access patterns before choosing a sharding strategy prevents rewrites later.
Platforms managing distributed workloads often shard by project or customer identifier, ensuring all data for a given workflow stays on the same database server. This enables transactions within a project while allowing independent scaling per customer tier.
Read replicas cut latency and distribute load
Reads explode faster than writes in most applications. Every dashboard refresh, every API call, every background sync hits the database, but only a fraction of requests actually modify data. Point your read-heavy APIs at replicas in secondary regions to cut latency while keeping sensitive data within compliance boundaries.
The tradeoff is eventual consistency — replicas lag behind the primary by milliseconds to seconds, depending on replication method and network conditions. For many use cases, this doesn't matter.
Displaying yesterday's analytics or showing user profiles can tolerate slight staleness.
For cases where it does matter (showing users their own just-submitted data), route those reads to the primary or implement read-your-writes consistency where the application tracks which data version the user wrote and waits for replicas to catch up.
Hybrid deployment models demonstrate how replicating data close to users cuts latency while keeping sensitive data within compliance boundaries. Deploy stateless services to public cloud regions for global reach while maintaining data stores in the specific areas or on-premises infrastructure for regulatory compliance.
Cache in layers to reduce database load
Even sharded, replicated databases hit limits under sufficient read load. Caching frequently accessed data closer to the application code reduces latency and database load simultaneously.
Build your cache in layers based on how often data changes and how much staleness you can tolerate.
In-process cache stores frequently requested items in application memory for microsecond access times, but capacity is limited by available RAM and data isn't shared across application instances.
A distributed cache, such as Redis or Memcached, shares data across all application instances. This significantly reduces database load at the cost of a few single-digit-millisecond network round-trips.
CDN edge caching serves static content from locations nearest to users, reducing origin server traffic and improving time-to-first-byte for users far from your primary region. The database query cache stores the results of expensive queries to avoid repeated computation.
Facebook developed TAO, a geographically distributed data store that mediates access to MySQL with graph-aware caching.
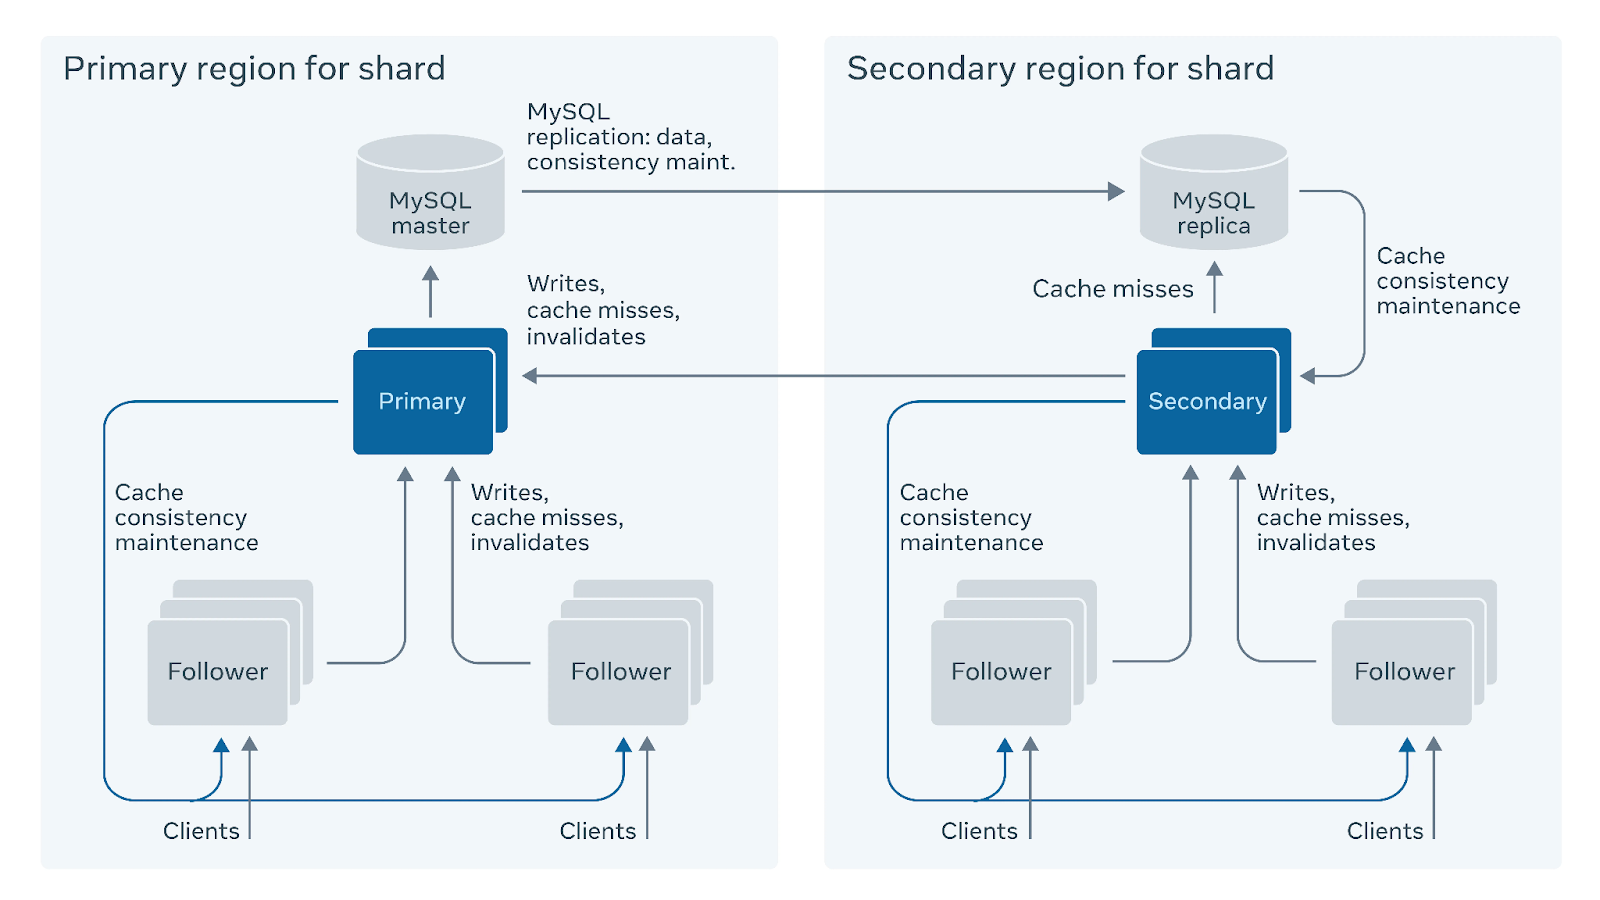
TAO sustains a billion reads per second on a dataset of many petabytes using a two-tier caching system with leader and follower tiers across multiple regions. This architecture demonstrates how caching layers can absorb read load that would overwhelm even heavily sharded databases.
The key insight: cache invalidation is hard, so build systems that tolerate stale data where possible.
For data that must be fresh, use TTLs measured in seconds rather than trying to invalidate perfectly. For critical consistency requirements, skip caching entirely and optimize the database layer instead.
Scaling the data layer requires understanding your read/write ratio, access patterns, consistency requirements, and operational complexity budget before choosing techniques.
The wrong approach (sharding a workload that requires cross-shard queries, caching data that changes constantly, and replicating writes that require strong consistency) creates more problems than it solves.
4. Build observability that catches problems before users do
Users will most likely tweet or post about your outage before your pager fires. When that happens, it's rarely a code bug — it's usually a blind spot in how you watch your own system. Engineers spend days debugging production incidents only to discover that the key metric that would have caught the problem early simply wasn't being measured.
Observability closes that gap by turning every request, event, and resource spike into breadcrumbs you can follow long after the incident review.
The difference between monitoring and observability matters.
Monitoring answers questions you knew to ask: "Is CPU above 80%?" Observability lets you explore questions you discover during incidents: "Which specific customer queries caused the p99 latency spike between 2:00 and 2:15 PM?"
The first requires predefined dashboards. The second requires structured logs, distributed traces, and metrics that you can slice arbitrarily.
Golden signals provide a universal baseline
Start with the four "golden signals" from Google's SRE book:
- Latency: How long requests take
- Traffic: How many requests you're handling
- Errors: What percentage of requests fail
- Saturation: How full your resources are
These metrics create a common language for engineers and product owners by measuring user experience rather than technical minutiae.
Pair golden signals with the RED trio (rate, errors, and duration), which essentially reframes the same concepts for service-oriented architectures. Stream these metrics into time-series stores like Prometheus and visualize them on Grafana dashboards.
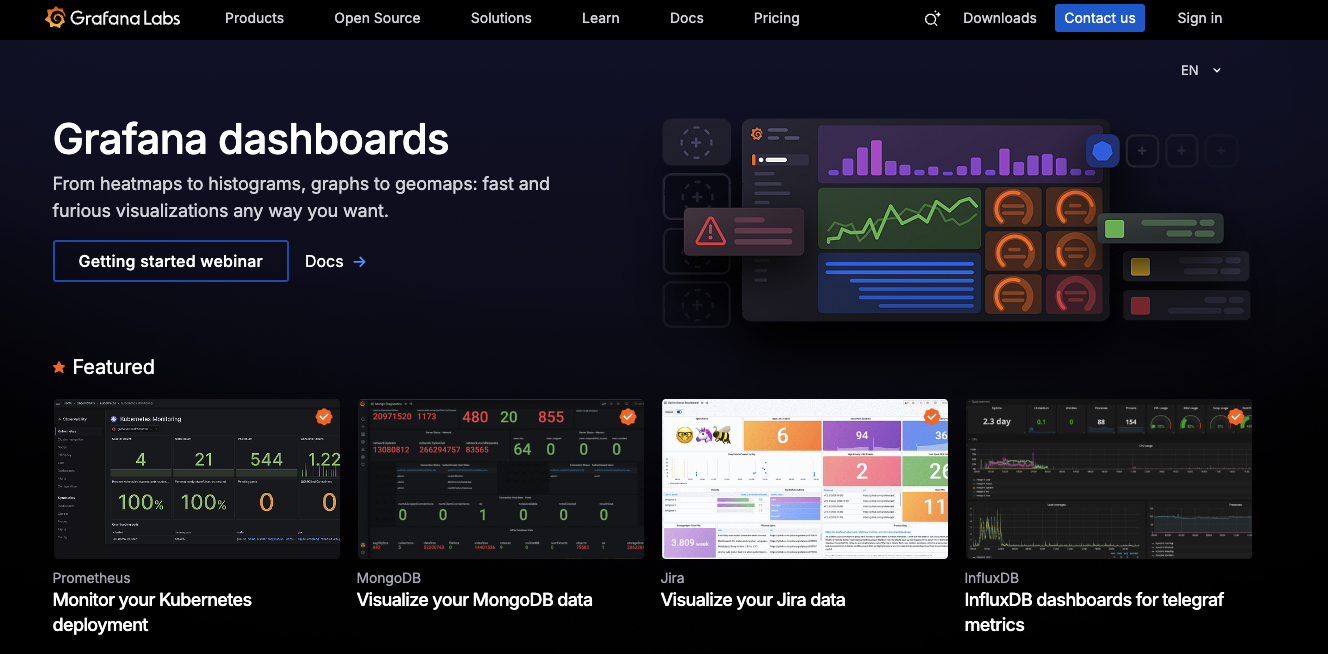
This infrastructure becomes the foundation for understanding system behavior under load.
For distributed systems, add distributed tracing using OpenTelemetry to pipe spans into Jaeger. Watch a single user journey hop from API gateway through authentication, into project allocation, across quality measurement services, and finally to data persistence — all with latency breakdowns showing where time was actually spent.
This visibility transforms debugging from guess-and-check into scientific investigation.
Platforms processing millions of events daily run this playbook by instrumenting event flows from ingestion through processing to completion. Built-in dashboards display throughput, lag, and queue depth on a single screen, letting teams course-correct before quality slips.
When CPU spikes across microservices, Grafana graphs show which service caused the spike, and distributed tracing reveals which specific code path caused it.
SLO-driven alerting cuts noise
Alert fatigue kills on-call effectiveness. When engineers get paged for every minor blip, they start ignoring alerts or disabling them entirely.
Service Level Objectives (SLOs) fix this by defining user-centric promises ("p95 request latency under 250ms, 99.9% of the time") and wiring alerts to the error budget rather than every individual violation.
Calculate your error budget from the SLO.
If you promise 99.9% availability, you have 43 minutes of downtime per month to "spend" on incidents, deployments, or experiments. When you've consumed 50% of your monthly error budget in the first week, that's worth paging someone. When p95 latency spikes for 30 seconds but you're still within budget, that's worth logging but not waking anyone up.
Practical SLO implementation looks like this:
- Define latency thresholds that alert when p95 exceeds the target, not on individual slow requests
- Establish error budgets that calculate acceptable failure rates (0.1% equals 43 minutes of downtime per month)
- Set saturation metrics that trigger when resources approach limits, not when they're already maxed
- Baseline traffic patterns to distinguish anomalies from expected variance
This single change (shifting from threshold-based alerts to budget-based alerts) cuts alert fatigue while keeping engineers focused on work that moves the reliability needle. When you describe that feedback loop in a staff-plus interview, you demonstrate systems thinking beyond just code.
Instrumentation as feature work
The hardest part of observability is the discipline to instrument code paths during initial development rather than adding metrics during incidents.
Treat instrumentation as feature work:
- Add trace spans when you add new services
- Log structured data when you handle errors
- Emit metrics when you see patterns worth tracking
A practical rollout starts small:
- Instrument first-request response paths with OpenTelemetry
- Sketch a minimal Grafana dashboard showing golden signals
- Establish one SLO for your most critical endpoint, and run a small load test to validate thresholds
- Feed test data back into dashboards to ensure alerts fire at the right times and don't fire during normal operations
- Expand coverage service by service, learning what's worth measuring versus what creates noise
Systems that process distributed work instruments every stage of the pipeline: work submitted, work allocated, work completed, work failed, and time spent in each state. This granular visibility reveals bottlenecks that wouldn't be obvious from high-level metrics alone — maybe work allocation is fast, but certain project types systematically timeout during processing.
This indicates capacity problems in specific worker pools rather than general system overload.
Observability pays for itself during the first major incident. Engineers who can query arbitrary dimensions in their logs, slice metrics by customer or project type, and follow distributed traces across service boundaries resolve problems in minutes instead of hours.
The investment in instrumentation, storage, and visualization infrastructure becomes obviously worthwhile when you're not scrambling to add metrics while the site is down.
5. Engineer fault tolerance before outages test your assumptions
One availability zone outage can bring down your entire system. You've probably lived that nightmare, watching dashboards turn red while users refresh in vain. The fix starts long before the outage, in how you design the system to survive component failures without human intervention.
Architecture as defense
Architecture is your first defense. Netflix migrated from a monolithic architecture to a microservices-based model to isolate services, reduce interdependencies, and enable faster recovery from failures.
The platform treats failure as inevitable and incorporates several techniques:
- Bulkheading: Isolating resource pools so failures don't spread
- Retries with exponential backoff: Handling transient failures without overwhelming recovering systems
- Circuit breakers: Preventing cascading failures by stopping requests to unhealthy dependencies
In 2011, Netflix released Chaos Monkey, a tool that purposefully shuts down production instances to guarantee services continue functioning even during unexpected failures.

This practice (now called chaos engineering) forces teams to build systems that survive failures rather than just hoping failures won't happen.
Platforms that break work into small, independent services recover faster because a fault in one piece doesn't bring down the rest. Switching to distributed services and event-driven messaging lets individual queues pause and replay without stopping other workflows. Projects stay alive even when one processor fails.
Geographic distribution survives regional failures
Geography is your second line of defense against outages. Active-active multi-region deployment means running full application stacks in multiple geographic regions simultaneously, with traffic distributed across all areas during normal operations.
When one region fails, whether from cloud provider issues, network failures, or data center problems, the other regions absorb its load automatically without manual failover. This approach survives regional outages but doubles infrastructure costs and introduces consistency challenges.
Applications must handle eventual consistency across regions because synchronous replication across continents adds hundreds of milliseconds of latency. For use cases requiring strong consistency, you need to choose between consistency and availability during network partitions (CAP theorem in practice), or architect carefully to minimize cross-region transactions.
Hybrid deployment models: SaaS control plane in public cloud plus on-premises data plane for sensitive data, spread risk across infrastructure types while meeting security requirements.
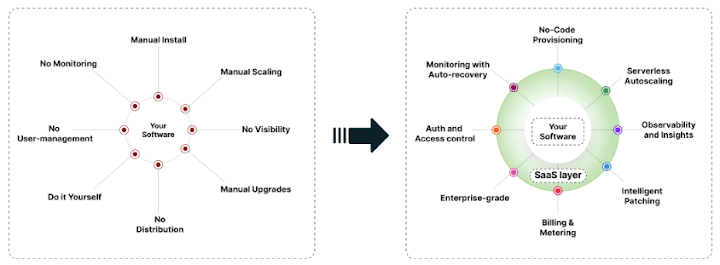
Mirror only stateless control services to public cloud regions for global reach and automatic failover while keeping data inside your own perimeter. You get resilience without exposing raw data, though at the cost of operational complexity, managing two environments.
Cost still matters when designing for fault tolerance.
Active-active clusters double infrastructure spend, so many companies pair stateless service redundancy with targeted replication for write-heavy data stores. This trims bills while keeping error budgets intact. The key is understanding which components are critical to availability and which failures are acceptable during incidents.
Resilience patterns that production systems rely on
Circuit breakers prevent cascading failures by detecting when a dependency is unhealthy and temporarily halting requests rather than overwhelming it with retries. Implementation tracks failure rates and response times — when errors exceed thresholds, the circuit "opens" and immediately returns errors without calling the dependency.
After a cooldown period, it allows a few test requests through. If they succeed, the circuit "closes" and normal traffic resumes. If they fail, it stays open.
Bulkheads isolate resource pools: separate thread pools, connection pools, or rate limits per client, so one misbehaving caller can't exhaust resources needed by other callers. If a background batch job starts issuing thousands of requests per second, it exhausts its own resource pool without affecting interactive user traffic.
Retries with exponential backoff handle transient failures (network blips, momentary overload) without overwhelming recovering systems. First retry after 100ms, second after 200ms, third after 400ms, with jitter added to prevent thundering herds.
But naive retry logic amplifies failures, so implement retries only for safe-to-retry operations (idempotent) and honor 429/503 responses that indicate the system can't handle additional load.
If you're interviewing for staff-level roles, expect to walk through these trade-offs: service isolation versus debugging complexity, hybrid resilience versus data-sovereignty constraints, and when N+1 redundancy pays for itself in saved user trust. Showing you can reason about blast radius and balance it with budget often separates senior engineers from principals.
Fault tolerance isn't free — it requires investment in redundant infrastructure, operational complexity, and engineering time building retry logic, circuit breakers, and graceful degradation. But the alternative (systems that completely fail during component failures) costs more in lost revenue, damaged reputation, and emergency midnight deploys.
6. Safeguard APIs with rate limiting and continuous load testing
Your launch-day API can start spitting out 429 errors the moment social media discovers your product. Every refresh spins up another request, and without a governor in place, you watch latency skyrocket while error logs pile up.
The problem compounds: slow responses cause client retries, retries create more load, more load slows responses further, and suddenly you're in a death spiral that takes down the entire system.
Rate limiting seems simple (just reject requests beyond a threshold), but a naive implementation can cause user experience problems.
Token Bucket Rate Limiting Balances Burst and Sustained Load
Token bucket algorithms address rate issues by allowing bursts while enforcing average rate limits. Each client gets a bucket that fills with tokens at a steady rate (say, 10 tokens per second).
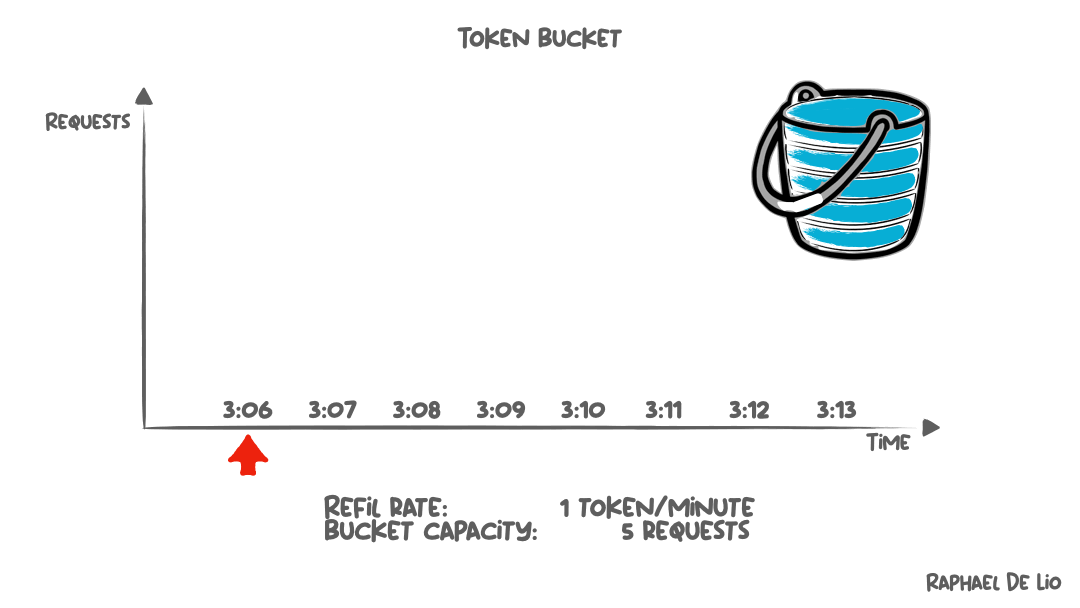
Each request consumes one token. If the bucket has tokens available, the request proceeds immediately. If the bucket is empty, the request is rejected with a 429 status code indicating the client should retry later.
This approach handles legitimate burst patterns (users who idle for a minute then submit several requests rapidly), while still protecting against sustained abuse. The bucket size determines burst tolerance, while the refill rate determines sustained throughput.
A bucket with 100 tokens refilling at 10 per second allows a client to burst up to 100 requests instantly, then sustain 10 requests per second indefinitely.
Distributed systems need distributed rate limiting. Platforms processing millions of requests route traffic to dozens of API servers, each of which needs to enforce rate limits without incurring coordination overhead.
Redis provides shared counters with atomic increment operations, enabling consistent rate limiting across application instances.
When an API server receives a request, it increments the client's Redis counter and checks if it exceeds the limit, all in a single atomic operation that prevents race conditions.
Architectural patterns that handle traffic spikes
The first line of defense is architecture itself.
A distributed, event-driven design routes each call to its own lightweight queue and lets a dedicated resource-allocation service decide when to accept, defer, or shed load. This approach helps platforms maintain throughput during unexpected traffic bursts while keeping downstream systems stable.
When frontend APIs get slammed, queues absorb the spike and workers process items at sustainable rates rather than overloading databases.
Platforms coordinating distributed work demonstrate this pattern:
- Incoming requests flow through an API gateway that enforces authentication and initial rate limiting
- Successful requests get queued for processing
- Worker allocation services pull from queues at rates determined by available capacity
- Quality measurement services validate results before marking work complete
Each layer has independent capacity controls and graceful degradation strategies.
Because traffic patterns shift, you need environments that flex with them. Hybrid and private-cloud deployments let you spin up extra capacity close to users during expected spikes (product launches, marketing campaigns, seasonal patterns), while keeping baseline infrastructure efficient.
When demand recedes, tear down temporary capacity and stop paying for idle resources.
API protection techniques that scale
Beyond rate limiting, several complementary techniques protect APIs from overload. Pagination with cursors prevents massive result sets from overwhelming clients and servers.
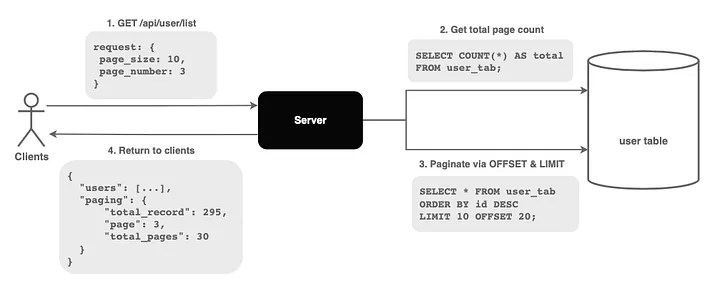
Instead of returning 10,000 records, return 100 records plus a cursor token clients can use to fetch the next page. This bounds memory usage and response times while letting clients retrieve as much data as they need.
Compression with gzip or Brotli reduces bandwidth usage for text-heavy responses, letting the same network infrastructure handle more traffic. Enable compression in your API gateway, application servers, and clients to automatically decompress responses.
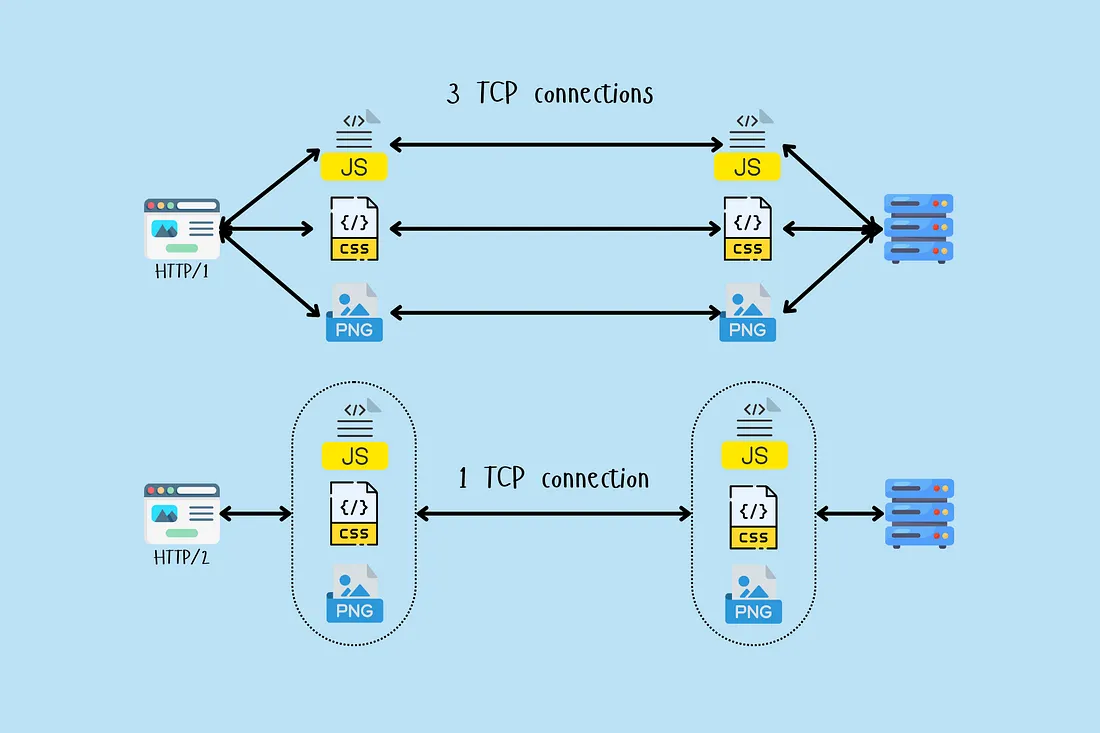
HTTP/2 multiplexing also enables multiple requests over a single TCP connection, reducing overhead from connection establishment and allowing more efficient use of network resources.
For GraphQL APIs, batching combines multiple queries to minimize round trips — clients send a batch of queries in a single request, the server processes them, and returns combined results, reducing latency and server load compared to individual requests.
Load testing validates protection under real conditions
All of this only works if you test as you run. Continuous synthetic traffic validates that rate limiting triggers at expected thresholds, autoscaling provisions capacity before queues overflow, and graceful degradation maintains core functionality when components fail.
Real-time dashboards show p95 latency, error rates, and throughput. Automatic alerts fire when metrics drift outside SLO budgets.
Run load tests that mimic production patterns: steady-state baseline load, gradual ramps that test autoscaling, sharp spikes that verify burst handling, sustained overload that tests rate limiting and queue depth management, and recovery scenarios that validate how systems handle load drops after spikes.
Feed these numbers back into your rate-limiting rules and capacity planning, iterate based on what breaks, and the cycle keeps your APIs steady instead of brittle.
Platforms that coordinate work across hundreds of thousands of remote contributors demonstrate these principles in production:
- Distributed rate limiting per user and per project type
- Event-driven architecture that absorbs traffic spikes into queues
- Autoscaling based on queue depth rather than just CPU metrics
- Continuous synthetic testing that validates protection mechanisms work under realistic loads
The key insight: API protection isn't a single technique but a layered defense.
Rate limiting stops abusive clients, architecture absorbs legitimate spikes, caching reduces load on expensive operations, compression improves bandwidth efficiency, and continuous testing validates that the whole system works together under pressure.
Contribute to AGI development at DataAnnotation
If your background includes technical expertise and you know how to write code and debug systems with critical thinking to spot what automated systems miss, AI training at DataAnnotation positions you at the AI training frontier and AGI development.
Not as a button-clicker earning side income, but as someone whose judgment determines whether billion-dollar AI training runs advance capabilities or learn to optimize the wrong objectives.
Coding projects start at $40 per hour for code evaluation and AI performance assessment across Python, JavaScript, HTML, C++, C#, SQL, and other languages. If you have genuine expertise, you can help build the most important technology of our time at DataAnnotation.
If you want in, getting started takes five straightforward steps:
- Visit the DataAnnotation application page and click “Apply”
- Fill out the brief form with your background and availability
- Complete the Starter Assessment, which tests your critical thinking and coding skills
- Check your inbox for the approval decision (typically within a few days)
- Log in to your dashboard, choose your first project, and start earning
No signup fees. DataAnnotation stays selective to maintain quality standards. You can only take the Starter Assessment once, so read the instructions carefully and review before submitting.
Apply to DataAnnotation if you understand why quality beats volume in advancing frontier AI — and you have the expertise to contribute.
.jpeg)